Installing Prometheus stack with Helm
Overview
Not once practice demonstrated to me that if there are some historical statistics about working system it will be much more easier to understand how system works and solve any problem which may happen. With Kubernetes I believe the most first step (before running any application pod) should be installing of monitoring components which would tell you about your cluster as much as possible - to know how busy nodes are in CPU, memory, disk and network IO and so on.
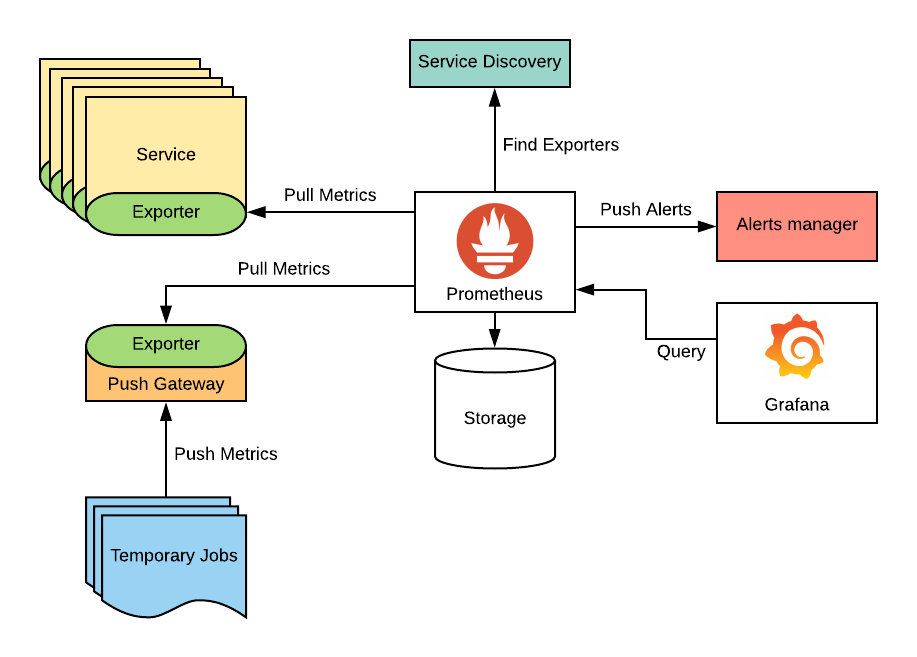
The most frequently used monitoring system for Kubernetes (and not only for it) these days is Prometheus which is built as cloud native application from the beginning. It can query metrics on remote targets, store collected metric in time series database and even visualize them in web GUI. However very often Prometheus is used in linked with Grafana which is another monitoring tool but it has much more powerful UI for visualizing graphs from collected metrics. When Prometheus is used together with Grafana, Prometheus queries metrics and store them in its database, Grafana is used as UI for graphs only.
As Prometheus is cloud native native application it contains several independent components which should be installed correctly whole monitoring system to work correctly. It’s not trivial task if you just start exploring Kubernetes, so this is why for the beginning I recommend to install it with Helm, package manager for Kubernetes.
Preparations
Add required Helm repositories
# helm repo add prometheus-community https://prometheus-community.github.io/helm-charts
"prometheus-community" has been added to your repositories

# helm repo add stable https://charts.helm.sh/stable
"stable" has been added to your repositories

# helm repo update
Hang tight while we grab the latest from your chart repositories...
...Successfully got an update from the "prometheus-community" chart repository
...Successfully got an update from the "stable" chart repository
Update Complete. ⎈Happy Helming!⎈

# helm repo list
NAME                	URL
prometheus-community	https://prometheus-community.github.io/helm-charts
stable              	https://charts.helm.sh/stable
For installing all required Prometheus components kube-prometheus-stack helm chart from prometheus-community repository will be used, stable repository is used for installing of packages which prometheus components depend on (for instance grafana).
Create monitoring namespace
It’s good practice to create isolated namespaces for different applications (or their stacks) which run in your cluster, so monitoring namespace should be created to put there everything related to Prometheus and its components.
# kubectl create namespace monitoring
Create persistent volumes and their claims
Containers use ephemeral volumes - it means all data is destroyed if container is deleted or created from scratch, from another side as it’s not possible to predict what node each container will run on it’s crucial to use persistent volumes for Prometheus components as Grafana (and Prometheus itself).
# cat > grafana-pv.yml
apiVersion: v1
kind: PersistentVolume
metadata:
  name: grafana-pv
spec:
  capacity:
    storage: 50Mi
  accessModes:
    - ReadWriteOnce
  hostPath:
    path: /mnt/nfsserver/grafana


# kubectl apply -f grafana-pv.yml
persistentvolume/grafana-pv created

# kubectl get pv | grep grafana
grafana-pv   50Mi       RWO            Retain           Available                                               37s

# cat > grafana-pvc.yml
apiVersion: v1
kind: PersistentVolumeClaim
metadata:
  namespace: "monitoring"
  name: "grafana-pvc"
spec:
  storageClassName: ""
  accessModes:
    - ReadWriteOnce
  resources:
    requests:
      storage: "50Mi"

# kubectl apply -f grafana-pvc.yml

# kubectl get pv
NAME             CAPACITY   ACCESS MODES   RECLAIM POLICY   STATUS   CLAIM                    STORAGECLASS   REASON   AGE
grafana-pv       50Mi       RWO            Retain           Bound    monitoring/grafana-pvc                           1h

# kubectl get pvc -n monitoring
NAME          STATUS   VOLUME       CAPACITY   ACCESS MODES   STORAGECLASS   AGE
grafana-pvc   Bound    grafana-pv   50Mi       RWO                           1h
- I created pv and pvc for Prometheus either on the same NFS server and it worked fine for few days but then problems started. After investigation I’ve found that Prometheus needs a POSIX file system and NFS is not known for being a fully compliant POSIX filesystem. So I’m still looking for solution for what would be the best shared storage for Prometheus on home raspberry-cluster.
Create services
Services have to be create to have ability to connect to Grafana and Prometheus pods outside of cluster - via their external ip-addresses. As seen on examples below services are created as LoadBalancer type and Metallb should be configured accordingly.
# cat > grafana-web.yaml
apiVersion: v1
kind: Service
metadata:
  annotations:
    metallb.universe.tf/address-pool: default
  name: grafana-web
  namespace: monitoring
spec:
  type: LoadBalancer
  selector:
    app.kubernetes.io/instance: prometheus
    app.kubernetes.io/name: grafana
  ports:
    - port: 80
      targetPort: 3000

# kubectl apply -f grafana-web.yaml

# cat > prometheus-web.yaml
apiVersion: v1
kind: Service
metadata:
  annotations:
    metallb.universe.tf/address-pool: default
  name: prometheus-web
  namespace: monitoring
spec:
  type: LoadBalancer
  selector:
    app: prometheus
    prometheus: prometheus-kube-prometheus-prometheus
  ports:
    - port: 9090
      targetPort: 9090

# kubectl apply -f prometheus-web.yaml
Prepare values file
If you need to change some of default settings which come with helm chart you can do it via values-file. As Grafana should use persistent volume the following content should be used for values-file.
# cat > kube-prometheus-stack-values.yaml
grafana:
  enabled: true
  persistence:
    enabled: true
    existingClaim: grafana-pvc
  initChownData:
    enabled: false
Installation
During install value file and namespace should be specified as per example:
# helm install -n monitoring --values kube-prometheus-stack-values.yaml prometheus prometheus-community/kube-prometheus-stack

# helm list -n monitoring
NAME         	NAMESPACE 	REVISION	UPDATED                                	STATUS  	CHART                         	APP VERSION
prometheus   	monitoring	1       	2021-01-17 18:04:37.72960561 +0200 EET 	deployed	kube-prometheus-stack-12.12.1 	0.44.0
After couple of minutes all required pod should be created and if everything is fine they will be in Running state.
# kubectl get pod --namespace monitoring -o wide
NAME                                                     READY   STATUS    RESTARTS   AGE    IP             NODE    NOMINATED NODE   READINESS GATES
alertmanager-prometheus-kube-prometheus-alertmanager-0   2/2     Running   4          6d5h   10.42.0.104    kube1   <none>           <none>
prometheus-prometheus-node-exporter-m9tll                1/1     Running   2          6d5h   192.168.8.21   kube1   <none>           <none>
prometheus-kube-state-metrics-6df5d44568-762m5           1/1     Running   2          6d5h   10.42.0.106    kube1   <none>           <none>
prometheus-prometheus-node-exporter-62vt2                1/1     Running   2          6d5h   192.168.8.22   kube2   <none>           <none>
prometheus-kube-prometheus-operator-7c657497cb-h9nz8     1/1     Running   2          6d5h   10.42.2.30     kube3   <none>           <none>
prometheus-prometheus-node-exporter-hdtmq                1/1     Running   2          6d5h   192.168.8.23   kube3   <none>           <none>
prometheus-grafana-64d66646d6-tprx5                      2/2     Running   4          6d5h   10.42.1.29     kube2   <none>           <none>
prometheus-prometheus-kube-prometheus-prometheus-0       2/2     Running   5          6d5h   10.42.2.31     kube3   <none>           <none>

# kubectl get service --namespace monitoring
NAME                                      TYPE           CLUSTER-IP      EXTERNAL-IP   PORT(S)                      AGE
prometheus-web                            LoadBalancer   10.43.231.209   192.168.8.2   9090:31145/TCP               6d5h
grafana-web                               LoadBalancer   10.43.236.94    192.168.8.3   80:31234/TCP                 6d5h
prometheus-kube-prometheus-prometheus     ClusterIP      10.43.97.75     <none>        9090/TCP                     6d5h
prometheus-kube-prometheus-alertmanager   ClusterIP      10.43.118.103   <none>        9093/TCP                     6d5h
prometheus-kube-state-metrics             ClusterIP      10.43.95.215    <none>        8080/TCP                     6d5h
prometheus-prometheus-node-exporter       ClusterIP      10.43.230.167   <none>        9100/TCP                     6d5h
prometheus-grafana                        ClusterIP      10.43.11.93     <none>        80/TCP                       6d5h
prometheus-kube-prometheus-operator       ClusterIP      10.43.113.72    <none>        443/TCP                      6d5h
alertmanager-operated                     ClusterIP      None            <none>        9093/TCP,9094/TCP,9094/UDP   6d5h
prometheus-operated                       ClusterIP      None            <none>        9090/TCP                     6d5h
Grafana should be available as http://192.168.8.3 and Prometheus - as http://192.168.2:9090, default password for Grafana’s admin user is prom-operator.
Useful
kube-state-metrics on arm
If after installing kube-prometheus-stack you find that kube-state-metrics pod is in CrashLoopBackOff state most probably it’s still not ready for ARM architecture.
# kubectl get pod -n monitoring
NAME                                                      READY   STATUS    RESTARTS   AGE
prometheus-prometheus-node-exporter-sl48d                 1/1     Running   0          5d19h
prometheus-prometheus-kube-prometheus-prometheus-0        2/2     Running   0          5d19h
prometheus-kube-prometheus-operator-7c657497cb-wd47n      1/1     Running   1          5d19h
alertmanager-prometheus-kube-prometheus-alertmanager-0    2/2     Running   2          5d19h
prometheus-prometheus-node-exporter-khb6w                 1/1     Running   1          5d19h
prometheus-prometheus-node-exporter-z8smt                 1/1     Running   2          5d19h
prometheus-grafana-64d66646d6-nxlwm                       2/2     Running   4          5d19h
prometheus-kube-state-metrics-6df5d44568-xlctq            0/1     CrashLoopBackOff   1643       5d19h

# kubectl get deployment -n monitoring
NAME                                     READY   UP-TO-DATE   AVAILABLE   AGE
prometheus-kube-prometheus-operator      1/1     1            1           5d19h
prometheus-grafana                       1/1     1            1           5d19h
prometheus-kube-state-metrics            0/1     1            0           5d19h

# kubectl logs prometheus-kube-state-metrics-6df5d44568-xlctq -n monitoring
standard_init_linux.go:211: exec user process caused "exec format error"
To solve it I edited kube-state-metrics deployment and replace image: quay.io/coreos/kube-state-metrics:v1.9.7 by image: carlosedp/kube-state-metrics:v1.9.6
kubectl edit deployment.apps/prometheus-kube-state-metrics -n monitoring
Uninstall
To remove all prometheus components with helm:
helm uninstall -n monitoring prometheus