Prometheus Exporters
Overview
It is possible to add to Prometheus modules (exporters) which would collect metrics from external objects via non-prometheus protocols (snmp as example) and then to provide them to Prometheus as usual targets.
Today I’m using the following exporters:
- snmp-exporter - to get network statistics from my network devices
- arm-exporter - to get cpu temperature of raspberry pi cpu
- blackbox-exporter - to check the availability of HTTP/S, DNS, TCP and ICMP endpoints
This is how I installed & configure them in my k3s cluster.
snmp-exporter
It’s officially supported exporter so it can be installed from prometheus-community helm repository. But before to continue with install I would recommend to check what values are available from helm-chart and update the ones which you need:
helm show values prometheus-community/prometheus-snmp-exporter
This is how my minimal configuration for snmp-exporter looks like, where 192.168.1.1 is ip-address of network device (my router) where SNMP service is accessible (default public community is configured on router):
cat > snmp-exporter-minimal-values.yml
serviceMonitor:
  enabled: true
  namespace: monitoring
  selector:
    release: prometheus
  params:
    enabled: true
    conf:
      module:
      - if_mib
      target:
      - 192.168.1.1
  path: /snmp
  scrapeTimeout: 10s
Prometheus (if it was installed from prometheus-community chart) should discover new exporter via defined serviceMonitor with selector release: prometheus. After installation can be initiated as per command:
helm install snmp-exporter prometheus-community/prometheus-snmp-exporter --values snmp-exporter-minimal-values.yml --namespace monitoring
The following components should be available in kubernetes cluster after installation from helm:
kubectl get servicemonitor -n monitoring | grep snmp
snmp-exporter-prometheus-snmp-exporter               27d
kubectl get pod -n monitoring | grep snmp
snmp-exporter-prometheus-snmp-exporter-795487bf7f-mdrsk   1/1     Running   0          27d
kubectl get svc -n monitoring | grep snmp
snmp-exporter-prometheus-snmp-exporter    ClusterIP      10.43.145.254   <none>         9116/TCP                     27d

helm list -n monitoring
NAME         	NAMESPACE 	REVISION	UPDATED                                	STATUS  	CHART                         	APP VERSION
prometheus   	monitoring	4       	2021-01-24 12:46:41.763268004 +0200 EET	deployed	kube-prometheus-stack-12.12.1 	0.44.0
snmp-exporter	monitoring	1       	2021-01-17 21:07:27.952537816 +0200 EET	deployed	prometheus-snmp-exporter-0.1.1	0.19.0
In few minutes Prometheus will discover new exporter and snmp-exporter-prometheus-snmp-exporter should appear as one of targets. This is what is seen in Prometheus logs:
# kubectl logs prometheus-prometheus-kube-prometheus-prometheus-0 prometheus -n monitoring | tail
level=info ts=2021-01-17T07:47:28.602Z caller=kubernetes.go:263 component="discovery manager scrape" discovery=kubernetes msg="Using pod service account via in-cluster config"
level=info ts=2021-01-17T07:47:28.602Z caller=kubernetes.go:263 component="discovery manager scrape" discovery=kubernetes msg="Using pod service account via in-cluster config"
level=info ts=2021-01-17T07:47:28.603Z caller=kubernetes.go:263 component="discovery manager notify" discovery=kubernetes msg="Using pod service account via in-cluster config"
level=info ts=2021-01-17T07:47:28.656Z caller=main.go:892 msg="Completed loading of configuration file" filename=/etc/prometheus/config_out/prometheus.env.yaml totalDuration=61.473132ms remote_storage=2.539µs web_handler=406ns query_engine=1.045µs scrape=2.389645ms scrape_sd=2.872449ms notify=10.288µs notify_sd=565.165µs rules=52.820278ms
level=info ts=2021-01-17T07:48:56.671Z caller=main.go:861 msg="Loading configuration file" filename=/etc/prometheus/config_out/prometheus.env.yaml
level=info ts=2021-01-17T07:48:56.678Z caller=kubernetes.go:263 component="discovery manager scrape" discovery=kubernetes msg="Using pod service account via in-cluster config"
level=info ts=2021-01-17T07:48:56.679Z caller=kubernetes.go:263 component="discovery manager scrape" discovery=kubernetes msg="Using pod service account via in-cluster config"
level=info ts=2021-01-17T07:48:56.680Z caller=kubernetes.go:263 component="discovery manager scrape" discovery=kubernetes msg="Using pod service account via in-cluster config"
level=info ts=2021-01-17T07:48:56.680Z caller=kubernetes.go:263 component="discovery manager notify" discovery=kubernetes msg="Using pod service account via in-cluster config"
level=info ts=2021-01-17T07:48:56.730Z caller=main.go:892 msg="Completed loading of configuration file" filename=/etc/prometheus/config_out/prometheus.env.yaml totalDuration=58.912487ms remote_storage=2.183µs web_handler=930ns query_engine=1.504µs scrape=2.430848ms scrape_sd=3.320868ms notify=9.904µs notify_sd=815.355µs rules=49.269124ms

# kubectl logs prometheus-prometheus-kube-prometheus-prometheus-0 config-reloader -n monitoring
level=info ts=2021-01-17T07:18:33.18336883Z caller=main.go:147 msg="Starting prometheus-config-reloader" version="(version=0.44.0, branch=refs/tags/pkg/apis/monitoring/v0.44.0, revision=35c9101c332b9371172e1d6cc5a57c065f14eddf)"
level=info ts=2021-01-17T07:18:33.183409426Z caller=main.go:148 build_context="(go=go1.14.12, user=paulfantom, date=20201202-15:44:08)"
level=info ts=2021-01-17T07:18:33.183657026Z caller=main.go:182 msg="Starting web server for metrics" listen=:8080
level=error ts=2021-01-17T07:18:33.241800474Z caller=runutil.go:98 msg="function failed. Retrying in next tick" err="trigger reload: reload request failed: Post \"http://127.0.0.1:9090/-/reload\": dial tcp 127.0.0.1:9090: connect: connection refused"
level=info ts=2021-01-17T07:18:38.300910386Z caller=reloader.go:347 msg="Reload triggered" cfg_in=/etc/prometheus/config/prometheus.yaml.gz cfg_out=/etc/prometheus/config_out/prometheus.env.yaml watched_dirs=/etc/prometheus/rules/prometheus-prometheus-kube-prometheus-prometheus-rulefiles-0
level=info ts=2021-01-17T07:18:38.301158905Z caller=reloader.go:214 msg="started watching config file and directories for changes" cfg=/etc/prometheus/config/prometheus.yaml.gz out=/etc/prometheus/config_out/prometheus.env.yaml dirs=/etc/prometheus/rules/prometheus-prometheus-kube-prometheus-prometheus-rulefiles-0
level=info ts=2021-01-17T07:47:28.657026968Z caller=reloader.go:347 msg="Reload triggered" cfg_in=/etc/prometheus/config/prometheus.yaml.gz cfg_out=/etc/prometheus/config_out/prometheus.env.yaml watched_dirs=/etc/prometheus/rules/prometheus-prometheus-kube-prometheus-prometheus-rulefiles-0
level=info ts=2021-01-17T07:48:56.731168145Z caller=reloader.go:347 msg="Reload triggered" cfg_in=/etc/prometheus/config/prometheus.yaml.gz cfg_out=/etc/prometheus/config_out/prometheus.env.yaml watched_dirs=/etc/prometheus/rules/prometheus-prometheus-kube-prometheus-prometheus-rulefiles-0
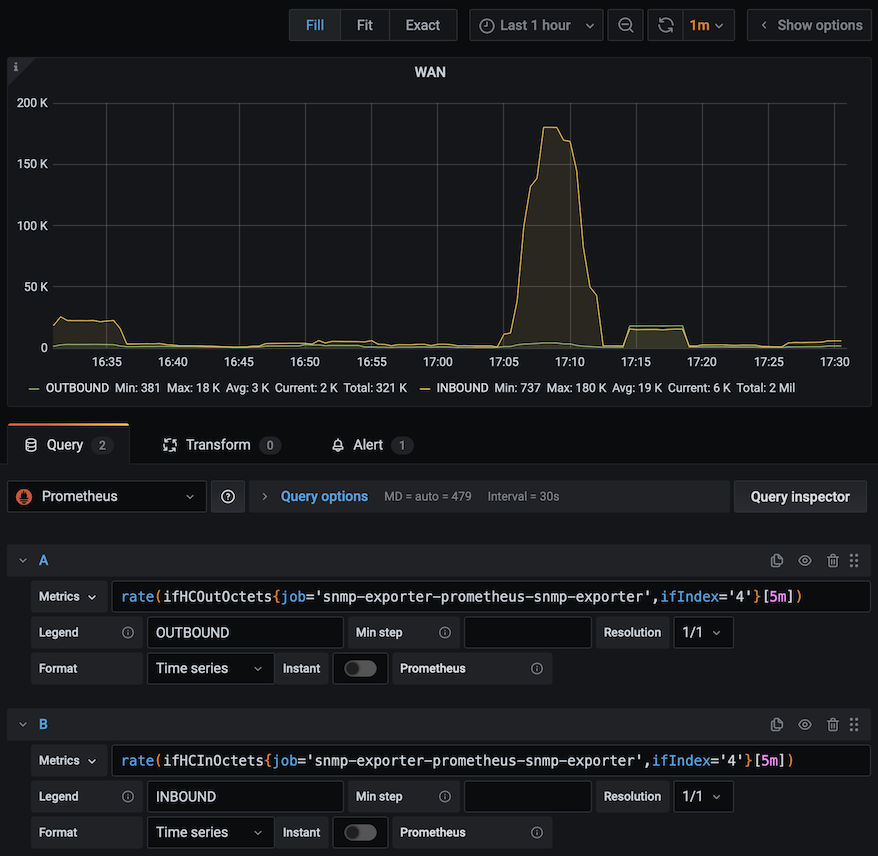
Then it will be possible to make graphs for snmp-metrics in Grafana:
arm-exporter
I built arm-exporter yaml-files from Carlos Eduardo’s Cluster Monitoring Repo with make and then update armexporter-serviceMonitor.yaml as per the following (to add release: prometheus to labels):
cat armexporter-serviceMonitor.yaml
apiVersion: monitoring.coreos.com/v1
kind: ServiceMonitor
metadata:
  labels:
    app: arm-exporter
    release: prometheus
  name: arm-exporter
  namespace: monitoring
spec:
  endpoints:
  - bearerTokenFile: /var/run/secrets/kubernetes.io/serviceaccount/token
    interval: 30s
    port: https
    relabelings:
    - action: replace
      regex: (.*)
      replacement: $1
      sourceLabels:
      - __meta_kubernetes_pod_node_name
      targetLabel: instance
    scheme: https
    tlsConfig:
      insecureSkipVerify: true
  jobLabel: arm-exporter-exporter
  namespaceSelector:
    matchNames:
    - monitoring
  selector:
    matchLabels:
      k8s-app: arm-exporter
Then just apply all armexporter-files:
ls -la
total 40
drwxr-xr-x 2 root root  4096 Jan 17 23:09 .
drwxrwsrwx 3 1030 users 4096 Jan 31 10:32 ..
-rw-r--r-- 1 root root   263 Jan 17 21:51 armexporter-clusterRoleBinding.yaml
-rw-r--r-- 1 root root   282 Jan 17 21:51 armexporter-clusterRole.yaml
-rw-r--r-- 1 root root  1736 Jan 17 21:51 armexporter-daemonset.yaml
-rw-r--r-- 1 root root    91 Jan 17 21:51 armexporter-serviceAccount.yaml
-rw-r--r-- 1 root root   671 Jan 17 23:09 armexporter-serviceMonitor.yaml
-rw-r--r-- 1 root root   244 Jan 17 21:51 armexporter-service.yaml

kubectl apply -f arm*

kubectl get pod -n monitoring | grep arm
arm-exporter-48rps                                        2/2     Running   0          27d
arm-exporter-mgvq4                                        2/2     Running   2          27d
arm-exporter-rmmc8                                        2/2     Running   2          27d
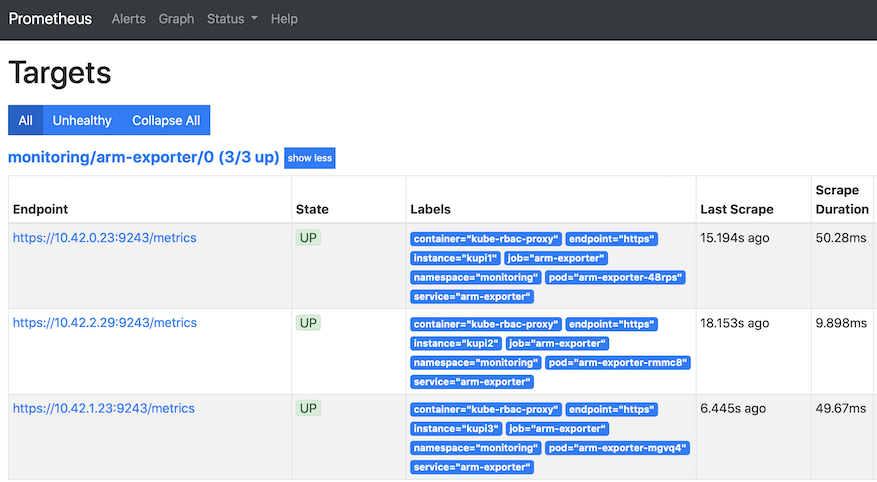
After few minutes prometheus will see new exporter and they should be available as targets - one target per each Kubernetes node:
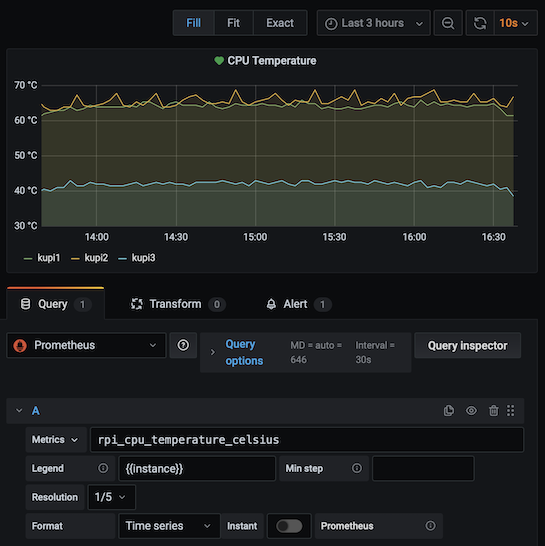
 Next step is to create graph in Grafana:
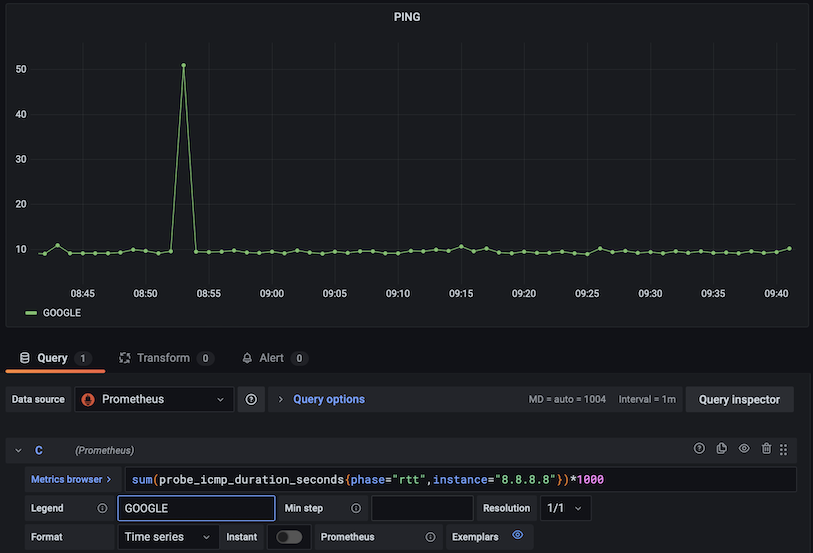
blackbox-exporter
It’s also officially supported exporter so it can be installed from prometheus-community helm repository. This is how my minimal configuration for blackbox-exporter looks like, where 192.168.1.1 is my router and 78.60.180.254 is my provider’s router:
cat > snmp-exporter-minimal-values.yml
podSecurityContext:
  sysctls:
  - name: net.ipv4.ping_group_range
    value: "0 65536"
config:
  modules:
    icmp:
      prober: icmp
      icmp:
        preferred_ip_protocol: "ip4"
serviceMonitor:
  enabled: true
  namespace: monitoring
  defaults:
    labels:
      release: prometheus
    interval: 30s
    scrapeTimeout: 30s
  targets:
    - name: router
      module: icmp
      url: 192.168.1.1
    - name: providerrouter
      module: icmp
      url: 78.60.180.254
    - name: google
      module: icmp
      url: 8.8.8.8
    - name: amazon.de
      url: https://www.amazon.de
After installation can be initiated as per command:
helm install blackbox-exporter prometheus-community/prometheus-blackbox-exporter --values prometheus-blackbox-exporter-values.yml --namespace monitoring
The following components should be available in kubernetes cluster after installation from helm:
# kubectl get servicemonitor -n monitoring | grep blackbox
blackbox-exporter-prometheus-blackbox-exporter-router              3d21h
blackbox-exporter-prometheus-blackbox-exporter-providerrouter      3d21h
blackbox-exporter-prometheus-blackbox-exporter-google              3d17h
blackbox-exporter-prometheus-blackbox-exporter-amazon.de           3d17h

# kubectl get svc -n monitoring | grep blackbox
blackbox-exporter-prometheus-blackbox-exporter   ClusterIP      10.43.53.171    <none>         9115/TCP       3d21h

# helm list -n monitoring
NAME              NAMESPACE   REVISION  UPDATED                                   STATUS    CHART                               APP VERSION
blackbox-exporter monitoring  7         2023-09-23 10:01:28.040944704 +0300 EEST  deployed  prometheus-blackbox-exporter-8.2.0  v0.24.0
prometheus        monitoring  1         2022-05-28 23:04:37.940504277 +0300 EEST  deployed  kube-prometheus-stack-16.7.0        0.48.1
snmp-exporter     monitoring  6         2023-09-22 17:15:51.547035207 +0300 EEST  deployed  prometheus-snmp-exporter-1.1.0      0.19.0
Next step is to create graph in Grafana: