Alerting in Grafana to Telegram
Overview
After you have working monitoring solution based on Prometheus/Grafana the next step is to get alerts for cases which you want to be informed.
kube-prometheus-stack brings alertmanager component which allows to handle alerts which are generated by prometheus or any other clients. It can route, suppress, group, de-duplicate alerts, but configuration has to be done via config-files (via operator if it’s running in kubernetes) so it’s not easy to manage and amend “on the fly”.
Alternatively Grafana itself (from the same kube-prometheus-stack) can generate alerts and moreover it can use Telegram Bot to generate alerts.
So plan is the following:
- Reinstall kube-prometheus-stack without alertmanager
- Register Telegram bot
- Create Telegram channel and add access there for bot which was just created
- Configure Telegram as Notification channel in Grafana
- Enable alerts for desired metrics in Grafana using Telegram as notification channel for it
Reinstall kube-prometheus-stack without alertmanager
Add to kube-prometheus-stack-values.yaml the following:
cat >> kube-prometheus-stack-values.yaml
alertmanager:
  enabled: false
And then upgrade kube-prometheus-stack with helm and confirm no alertmanager-prometheus-kube-prometheus-alertmanager-0 pod exist anymore
helm upgrade -n monitoring --values kube-prometheus-stack-values.yaml prometheus prometheus-community/kube-prometheus-stack

Release "prometheus" has been upgraded. Happy Helming!
NAME: prometheus
LAST DEPLOYED: Sat Feb 20 16:57:59 2021
NAMESPACE: monitoring
STATUS: deployed
REVISION: 5
NOTES:
kube-prometheus-stack has been installed. Check its status by running:
  kubectl --namespace monitoring get pods -l "release=prometheus"

Visit https://github.com/prometheus-operator/kube-prometheus for instructions on how to create & configure Alertmanager and Prometheus instances using the Operator.

# helm history prometheus -n monitoring
REVISION	UPDATED                 	STATUS    	CHART                        	APP VERSION	DESCRIPTION
1       	Sun Jan 17 18:04:37 2021	superseded	kube-prometheus-stack-12.12.1	0.44.0     	Install complete
2       	Sun Jan 24 12:29:47 2021	superseded	kube-prometheus-stack-12.12.1	0.44.0     	Upgrade complete
3       	Sun Jan 24 12:34:26 2021	superseded	kube-prometheus-stack-12.12.1	0.44.0     	Rollback to 1
4       	Sun Jan 24 12:46:41 2021	superseded	kube-prometheus-stack-12.12.1	0.44.0     	Upgrade complete
5       	Sat Feb 20 16:57:59 2021	deployed  	kube-prometheus-stack-12.12.1	0.44.0     	Upgrade complete

# kubectl get pod -n monitoring
NAME                                                      READY   STATUS    RESTARTS   AGE
prometheus-prometheus-node-exporter-sl48d                 1/1     Running   0          33d
snmp-exporter-prometheus-snmp-exporter-795487bf7f-mdrsk   1/1     Running   0          33d
arm-exporter-48rps                                        2/2     Running   0          33d
prometheus-kube-prometheus-operator-7c657497cb-wd47n      1/1     Running   1          33d
arm-exporter-mgvq4                                        2/2     Running   2          33d
prometheus-prometheus-node-exporter-khb6w                 1/1     Running   1          33d
prometheus-kube-state-metrics-7b765d9f74-thnlr            1/1     Running   0          28d
prometheus-grafana-7d697d59f4-bpcq7                       2/2     Running   0          27d
prometheus-prometheus-node-exporter-z8smt                 1/1     Running   3          33d
arm-exporter-rmmc8                                        2/2     Running   4          33d
prometheus-prometheus-kube-prometheus-prometheus-0        2/2     Running   28         31h
Register Telegram bot
It’s really 5 minutes task as per How do I create a bot?, the only hard part is to find the name for bot which is not used by anyone yet.
After bot is created you have to have its Bot API Token in format like 1522404850:AAHg80RJMSQLBsLD47jAQq3qtotyRI3MNbk.
Create Telegram channel and add access there for bot which was just created
Create new Telegram private channel and add your bot as Administrator (bot can’t be added as usual subscriber). If you don’t like to provide full list of permissions to channel for bot, just leave the right to post the message - it will be enough.
Few minutes after bot is added to channel go to url https://api.telegram.org/bot1522404850:AAHg80RJMSQLBsLD47jAQq3qtotyRI3MNbk/getUpdates and you should get reply with details about created channel.
`
{“ok”:true,”result”:[{“update_id”:867972158,
“channel_post”:{“message_id”:5,”sender_chat”:{“id”:-1001469798833,”title”:”Alerts”,”type”:”channel”},”chat”:{“id”:-1001469798833,”title”:”Alerts”,”type”:”channel”},”date”:1611653459,”text”:”ping”}}]}
`
Find chat id (-1001469798833 in example above) - it will be needed either on next step.
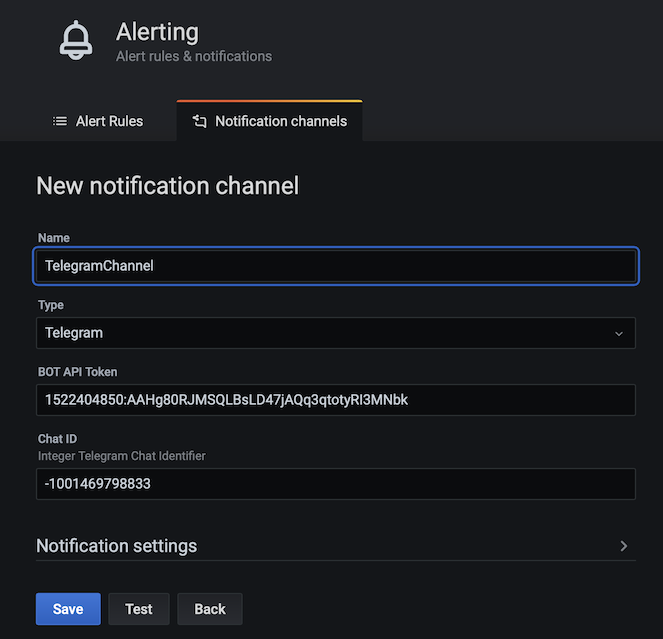
Configure Telegram as Notification channel in Grafana
In Grafana go to Alerting -> Notification Channel -> New Channel, specify name for new channel, BOT API Token, Chat ID and hit save.
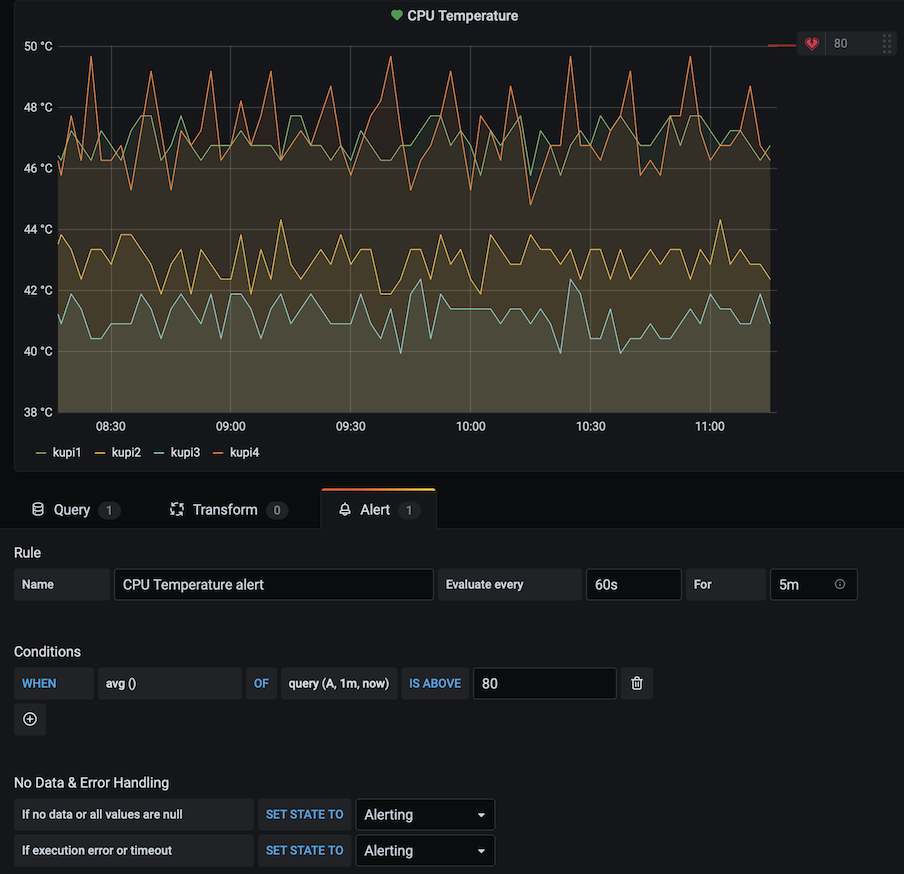
Enable alerts for metrics
Select Edit for metric which you want to get alerts for, select Alert tab and specify Rule, Conditions and Error Handling details.
In example below checks will be done each 60 seconds for 5 minutes and if it hits 80 (or above) alert will be generated.
If no data will be got or no response will be Alert will be generated either.
 If you have only one notification channel it will be used as default for all alerts, if you have many - don’t forget to specify which one you want to use for each alert.
All Grafana alerts are available on Alerting dashboard.